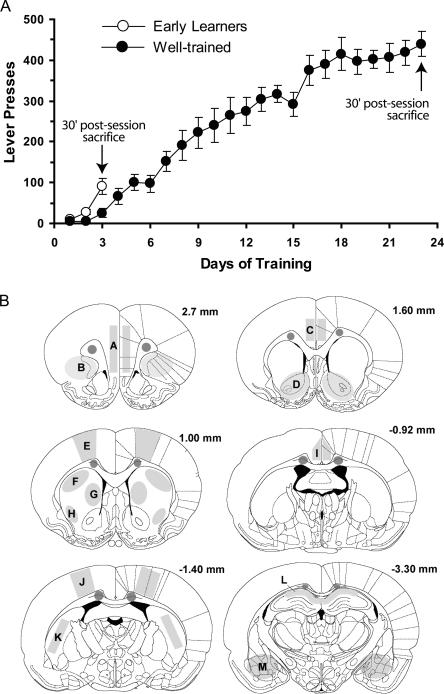
Figure 1.
Behavioral assessment of learning in rats used for Homer 1a and Zif268 in situ hybridization studies. (A) To compare gene expression in the brains of rats at different stages of learning, one group of rats, the Early Learners (n = 8, EL), were trained to lever-press for a sugar reward just until they demonstrated evidence of having acquired the response–outcome association (Day 3). A second group, the Overtrained group (n = 8, OT), was trained until asymptotic levels of responding were achieved to ensure all rats had maximized performance (Day 23). Two additional groups, the Early Learning Control (n = 6, ELC), and Overtrained Control (OTC, n = 5) groups did not have active levers, and therefore did not learn the task but were sacrificed at the same time point as the EL and OT groups, respectively. All rats were sacrificed 30 min following the end of their last 15-min session and processed for in situ hybridization. Data represent average number of lever presses ±SEM. (B) Coronal sections adapted from the atlas of Paxinos and Watson (1998) demonstrating where subsequent measures of Homer 1a and Zif268 signal were obtained. Sections are labeled in millimeters from bregma. Unlabeled shaded regions within the corpus callosum indicate where background measurements were taken. Labeled areas correspond to the following brain regions: A, medial prefrontal cortex (PFC); B, orbitofrontal cortex (OFC); C, anterior cingulate cortex (ACC); D, nucleus accumbens (NAc); E, primary motor cortex (Motor Cx); F, dorsal lateral striatum (DLS); G, dorsal medial striatum (DMS); H, ventrolateral striatum (VLS); I, middle cingulate cortex (MCC); J, sensory cortex (Sens Cx); K, posterior striatum (PS); L, hippocampus CA1 region (Hippo); M, amygdala (Amy).

