Figure 2.
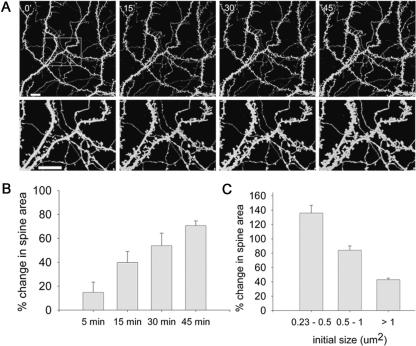
The increase in spine area is gradual and influenced by the initial spine size. (A, top) Three-dimensional reconstructed images of spines and dendrites taken at 0, 15, 30, and 45 min following 1-min exposure to glutamate. (Bottom) Zoomed areas marked in top left image. Scale bars, 10 μm. (B) Averaged increase in spine area 5, 15, 30, and 45 min following exposure to glutamate (14.8%, 39.4%, 54.1%, 70.57%; three coverslips, seven cells, 109 spines). One-way ANOVA for repeated-measures gave marginal results (F(1,2) = 7.718, P < 0.093). However, t-test comparing the initial and final time points yielded significant difference (P < 0.01). (C) The averaged increase in spine area is inversely correlated with its initial size (six coverslips, 13 cells; 0.23–0.5μm2: 135.82%, 0.5–1μm2: 84.2%, >1 μm2: 43.28%). A significant correlation was found between the average increase in spine area and its initial size (Rs = −0.931, P < 0.0001). In addition, the results were analyzed by linear regression: (F(1,16) = 88.752, P < 0.0001; R2 = 0.847).

