
Figure 2.
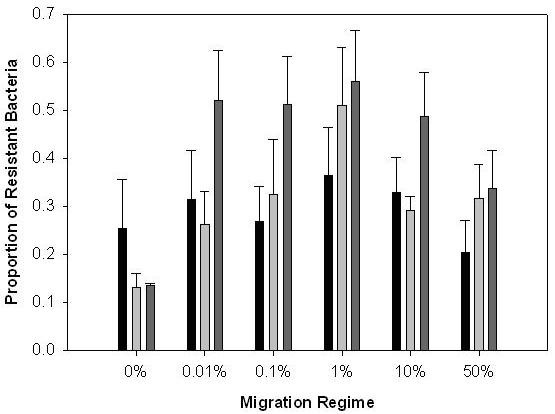
The effect of migration rate upon evolution of bacterial resistance ranges through time. Bars show mean (± 1 SEM) proportion of bacteria resistant to phages from all migration treatments from the same time point. Black bars are transfer (time point) 4; light grey bars, transfer 8; dark grey bars, transfer 12. The system is directional with bacteria becoming more resistant to a wider range of genotypes, so a higher proportion of resistant bacteria indicates that populations have evolved more rapidly.