
Figure 3.
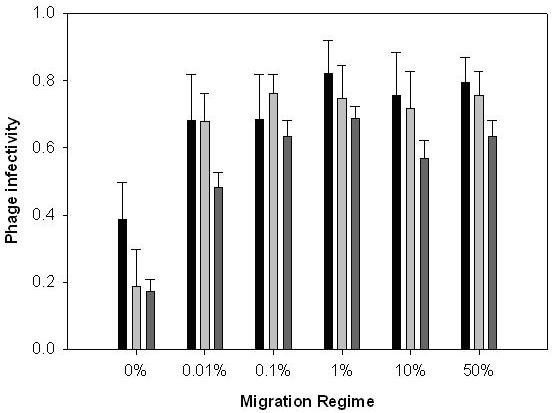
The effect of migration rate upon evolution of phage infectivity ranges through time. Bars show mean (± 1 SEM) proportion of bacteria from all migration treatments from the same time point that are sensitive to phages. Black bars are transfer (time point) 4; light grey bars, transfer 8; dark grey bars, transfer 12.