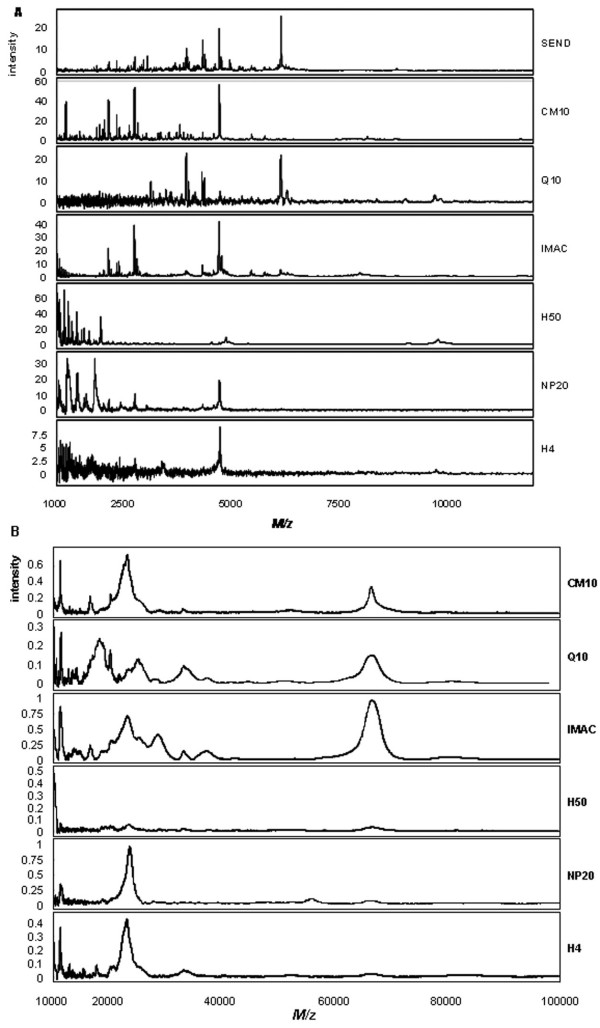
Figure 2.
Urinary protein profiles obtained with the different chip types. (A) Examples of urinary protein profiles for the 1 – 10 kDa mass range obtained with the different chip types as indicated and CHCA as matrix. (B) Examples of urinary protein profiles for the 10 – 100 kDa mass range obtained with the different chip types as indicated and SPA as matrix.

