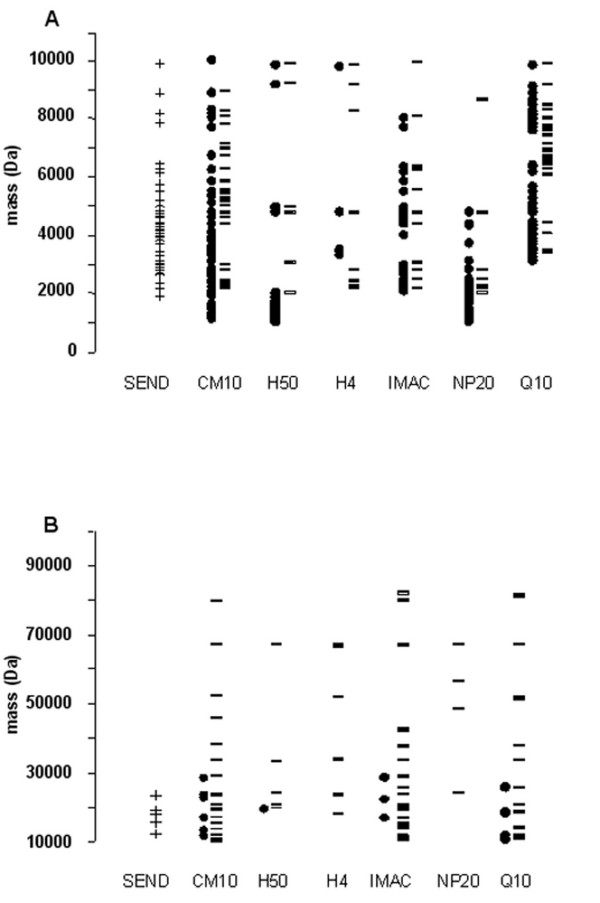
Figure 4.
Distribution of the detected masses for the different chip types. Distribution of the detected masses over the 1–10 kDa (panel A) and 10–100 kDa mass range (panel B). Black dots represent masses detected with CHCA, black stripes represent masses detected with SPA and the crosses represent masses detected with the SEND chip with covalently coupled CHCA. The different chip types used are indicated.

