
Figure 3.
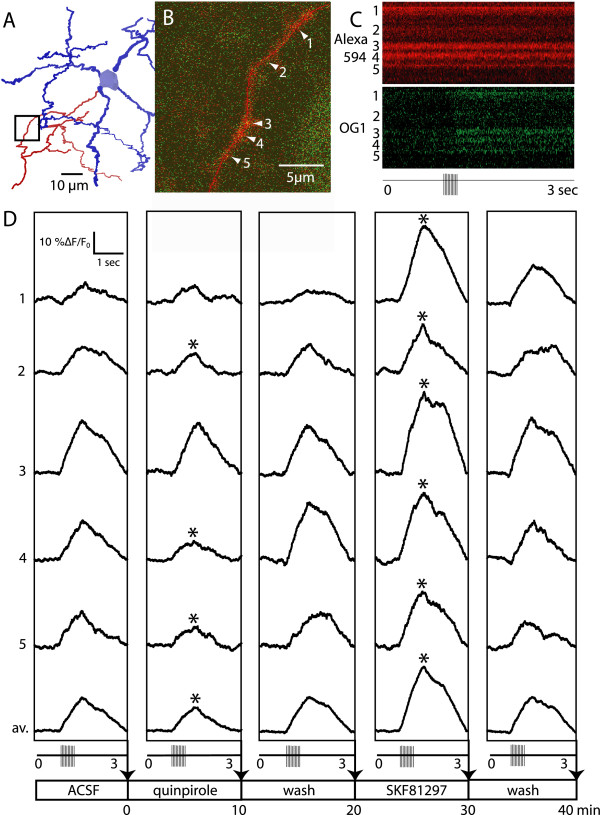
D1- and D2 modulation of individual varicosities on the same axonal segment. A. The MSN imaged is shown in a 3D reconstruction of a confocal z series of Alexa594 images. The cell body and multiple spiny dendrites are shown in blue and the single non-spine bearing axon is shown in red. The area imaged is outlined (black rectangle) and shown in panel B. B. In the OG1 fluorescence image, the stretch of axon that contained five hot spots (numbered). The spline used for the time scan is shown as a red line superimposed on the axonal segment. C. The spline scan images show no change in the Alexa594 fluorescence and a stimulus-dependent increase in OG1 fluorescence. D. Ca2+ imaging was carried out at 10 min intervals. The total duration of the experiment was 40 min. Asterisks identify Ca2+ responses that were significantly modulated by DA (> 5% of control). Note that the majority of varicosities showed modulation with both D1 and D2 agonists. The relative magnitude of modulation was strikingly heterogeneous.