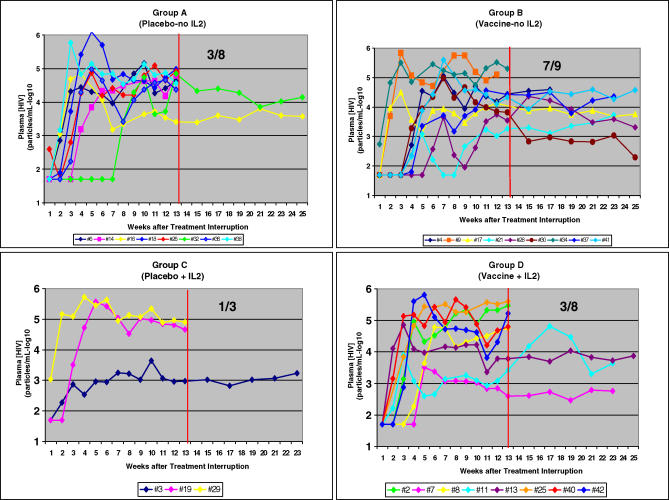
Figure 2. Plasma [HIV] during Steps II and III of Individuals According to Immunotherapy Treatment Group.
Red vertical line in center of each figure depicts the demarcation between Step II and Step III. Fractions in upper right corner of each figure portray the number of participants who were eligible to enter Step III in each group.

