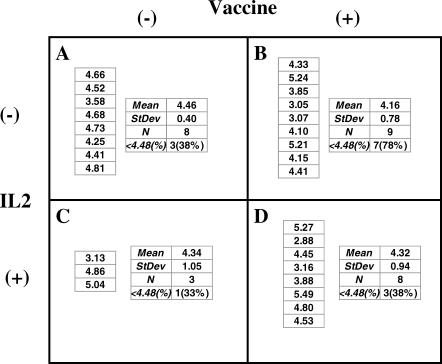
Figure 3. Results from Interim Analysis.
This was a 2×2 factorial study with participants randomized to receive vaccine (+) or not (−), and IL-2 (+) or no-IL-2 (−). The numbers listed in each block are the mean plasma [HIV] log10 RNA copies/ml for each participant from the last 5 weeks of Step II (i.e., weeks 21–25). There was no significant difference between the means of each group based on a 2×2 ANOVA.

