Fig.1.
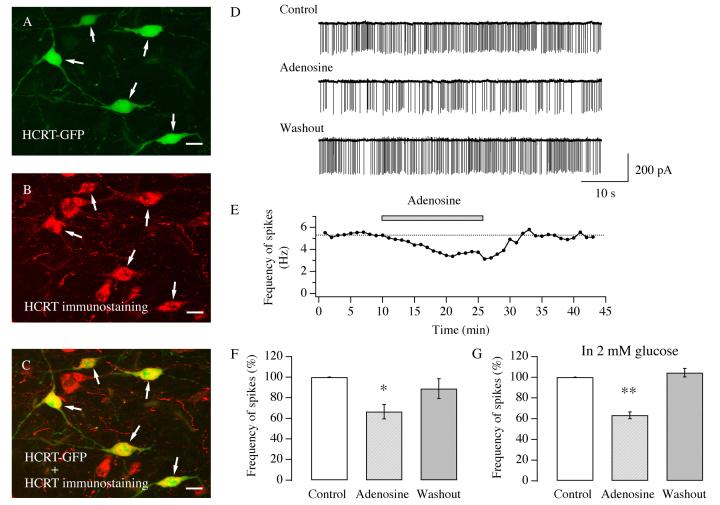
Adenosine depresses the frequency of action potentials in hypocretin/orexin neurons. A-C, double labeling of hypocretin/orexin neurons in brain slices. A, expression of GFP in hypocretin/orexin neurons under the control of a specific hypocretin/orexin promoter. B, immunocytochemical staining of hypocretin/orexin immunoreactive neurons (red). C, green and red signals overlap in hypocretin/orexin neurons indicated by arrows. All GFP-expressing neurons are hypocretin/orexin positive. Scale bar: AC, 15 μm. D-G, loose patch recordings of spikes (action currents) in visually identified hypocretin/orexin neurons were performed in slices from P14-21 mice expressing GFP in hypocretin/orexin neurons. D, sample traces of action currents recorded at various stages of our experiments under voltage clamp with loose patch recordings are presented. E, the time course of a typical experiment shows that adenosine (100 μM) applied to the recorded neuron attenuated the frequency of spikes. This attenuation was reversible upon the removal of adenosine. Application of adenosine is indicated by the filled bar. F, pooled data for frequency of spikes from all hypocretin/orexin neurons examined in our experiments are presented. An ANOVA was used to examine the significance of difference among all three groups. An asterisk “*” indicates P<0.05. G, pooled data for frequency of spikes from all 6 hypocretin/orexin neurons examined in ACSF containing 2 mM glucose are presented. An ANOVA was used to examine the significance of difference among all three groups. A double asterisk “**” indicates P<0.01.

