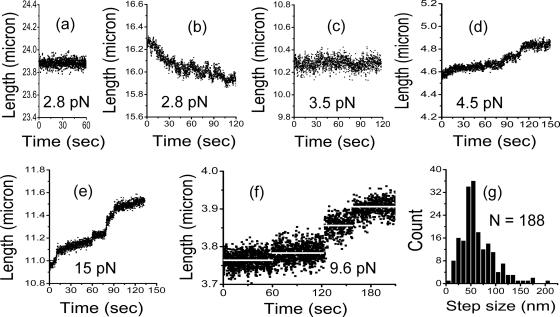
Figure 4.
Transverse MT results giving high-resolution DNA extension during chromatin assembly/disassembly, under −ATP (apyrase-treated) conditions. Each panel shows a time series of extension measurements at constant force as indicated. (a) Naked 79-kb DNA under a constant tension of 2.8 pN. The extension shows thermal fluctuations ∼100 nm around a fixed extension. (b) Same DNA as in a, following injection of −ATP extract. Assembly occurs as in Figure 3, but at the higher resolution of the transverse MT, step events of roughly 100-nm amplitude can be observed. Note that assembly and disassembly steps occur, but net assembly occurs due to a larger number of assembly steps. (c) Same DNA as a and b, but now at 3.5 pN, the stall force of the assembly reaction. Note the fluctuations of extension around its roughly constant value; by comparison with a, in addition to Brownian fluctuations, there are step-like fluctuations, of amplitude 50 and 100 nm. (d) Disassembly time series for 4.5 pN. After assembly of a fiber onto a 49-kb DNA at 1 pN, force was increased to 4.5 pN, leading to the disassembly trace shown here. The thermal fluctuations are slightly reduced by both the shorter DNA and the higher force. Step events of 50 and 100 nm are observed. (e) Same DNA as in d but now with force increased to 15 pN. Disassembly occurs more rapidly, and the steps are even more visible. Again, 50- and 100-nm steps are observed. (f) Disassembly time series of a chromatin fiber assembled onto a 15-kb DNA at 9.6 pN. Besides reducing the noise by the shorter molecule, plateau durations are increased due to the smaller number of nucleosomes along the DNA. Extension averages during the plateaus (white lines) allow step size measurement. A 25-nm step, a 50-nm step, and a 75-nm step can be seen. (g) Histogram of the step sizes for 188 steps collected from disassembly runs of 49-kb DNAs by using more than 9 pN. A well-defined peak occurs at ∼50 nm.

