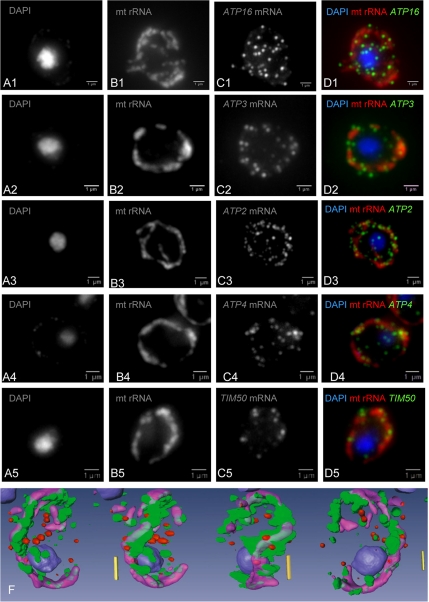
Figure 2.
Live-cell imaging of nuclear-encoded mRNAs for mitochondrial proteins. Five fluorescent oligonucleotides specific for mitochondrial rRNA (lane B) and for specific mRNAs (ATP16-C1, ATP3-C2, ATP2-C3, ATP4-C4, and TIM50-C5) were used to probe wild-type yeast cells for hybridization. The merged figures (lane D) indicate the relative localizations of mt rRNA (red) and the various mRNAs (green). 3D quantitative analysis was used to compare ATP16 mRNA, which is isotropically distributed, with the specifically localized ATP3 mRNA (Supplementary Figure 2S). A 3D reconstitution of these relative localizations is represented on the bottom line for ATP2 mRNA (green), mt rRNA (violet), and the negative control YRA1 mRNA (red). These 3D analyses allow a quantitative assessment of the distance between a particular mRNA molecule and the edge of the mitochondrion (see Supplementary Data).

