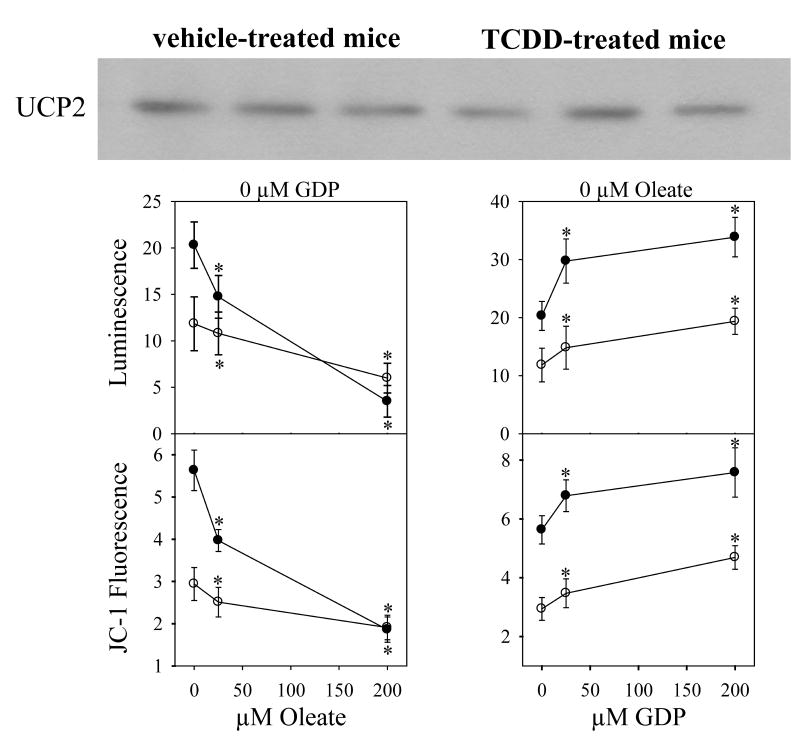
Fig. 1. UCP2 expression and function.
Mitochondria were prepared from mouse liver, 7 days after treatment with corn oil (open circles) or TCDD (closed circles). A Western immunoblot using a UCP2 antibody was performed using mitochondrial protein from 3 corn oil-treated mice (the left 3 blots) and from 3 TCDD-treated mice (the right 3 blots). The influence of effectors of UCP2 on H2O2 production was estimated using luminol chemiluminescence (center row, expressed as luminescence units X 10−3 min−1mg−1). The fatty acid oleate activates UCP2, while the purine nucleotide GDP inhibits. The influence of effectors of UCP2 on mitochondrial membrane potential was determined using JC-1 fluorescence ratios (lower row). A fluorescence ratio of 4 is approximately the equivalent of –180 mV.
Data are presented as the mean value ± S.E. (n = 3). Data were evaluated statistically using a two-way ANOVA, with the factors being TCDD and GDP concentration (left panels), and TCDD and oleate concentration (right panels). A three-way ANOVA was also performed and discussed in the Results section, with factors being oleate concentration, GDP concentration and TCDD treatment.
*P<0.05 versus 0 μM oleate (left panels), and versus 0 μM GDP (right panels), using Student-Newman-Keuls test for pairwise comparison.

