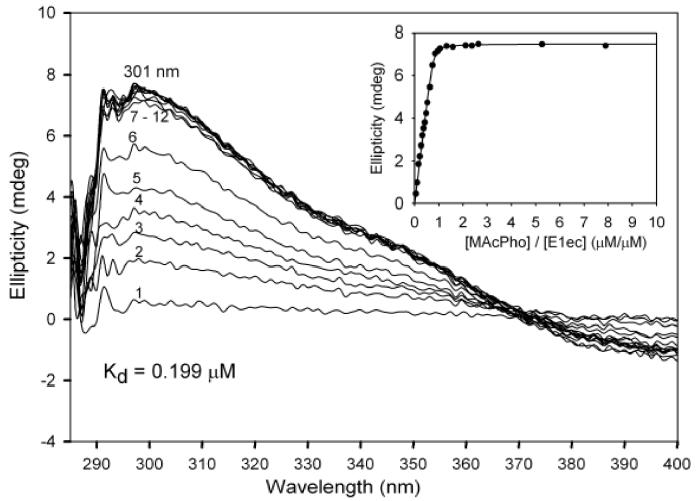
Figure 2.
Difference CD spectra of E1ec on addition of MAcPho. E1ec (1.90 mg/ml, concentration of active centers = 19 μM) in 20 mM potassium phosphate buffer (pH 7.0) containing 1 mM MgCl2 and 0.20 mM ThDP was titrated by MAcPho (μM): spectrum 1 (1.0); 2 (3.0); 3 (5.0); 4 (7.0); 5 (9.0); 6 (12.0); 7 (16.0); 8 (18.0); 9 (20.0); 10 (40.0); 11 (50.0); 12 (150.0). The difference CD spectra were obtained on subtraction of the spectrum of E1ec in the presence of MgCl2 and ThDP. Inset: dependence of the ellipticity at 301 nm on [MAcPho] / [E1ec] ratio.

