
Figure 4.
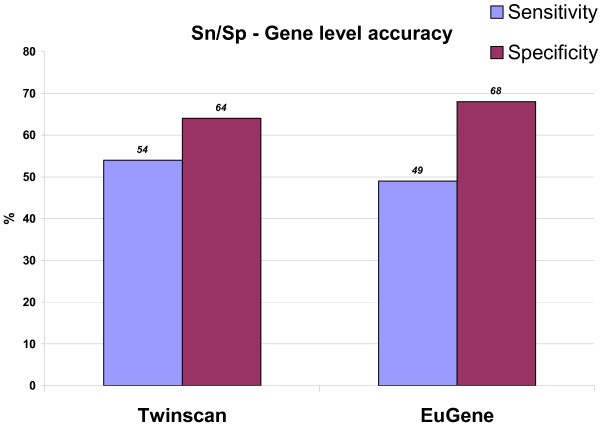
Structural accuracy of Twinscan and EuGene predictions. Gene level Sensitivity (Sn) and Specificity (Sp) were calculated using GTF files generated from BLAT alignment coordinates and the Eval software package.
Official websites use .gov
A
.gov website belongs to an official
government organization in the United States.
Secure .gov websites use HTTPS
A lock (
) or https:// means you've safely
connected to the .gov website. Share sensitive
information only on official, secure websites.
Structural accuracy of Twinscan and EuGene predictions. Gene level Sensitivity (Sn) and Specificity (Sp) were calculated using GTF files generated from BLAT alignment coordinates and the Eval software package.