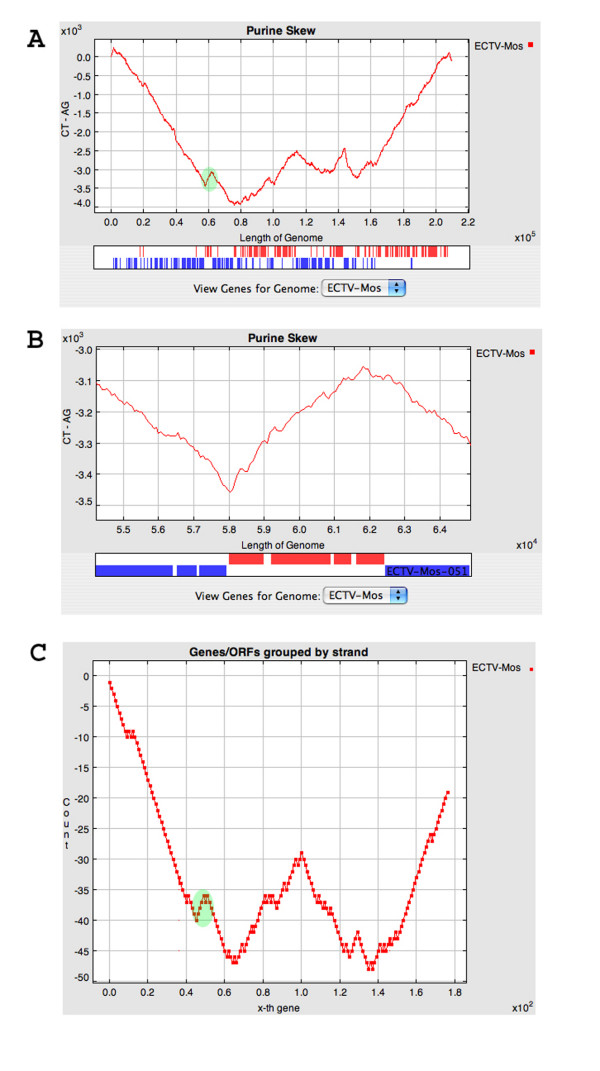
Figure 1.
Panel A: Purine skew for the complete genome of Ectromelia virus strain Moscow (NC_004105.1). Gene annotations for this genome are show below the skew plot; genes are shown as red and blue bars to illustrate transcription towards the left and right ends of the genome, respectively. Green highlight shows 4 genes that are transcribed rightwards, which are flanked by genes transcribed leftwards. Panel B: Purine skew for the region highlighted in Panel A. Panel C: Plot of transcription orientation for Ectromelia virus genes. For genes transcribed to the left and right, the plot moves down and up, respectively. Green highlight as in Panel A.

