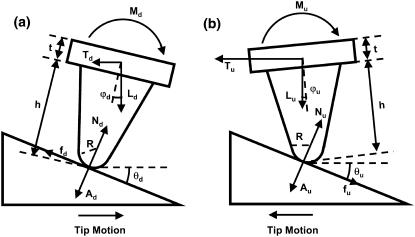
FIGURE A1.
Free-body diagrams of the cantilever tip during scanning in both (a) trace (downhill) and (b) retrace (uphill) motions, adapted from Fig. 1 of Varenberg et al. (35), where R is the tip end-radius; h the tip height; t the cantilever thickness; θu and θd the slope angles of the tilted region during upward and downward scans, respectively; and N, A, and f are the contact, adhesion, and friction forces executed between the probe tip and the sample surface, respectively; and L, T, M are the applied normal and lateral forces and the torsion moment, respectively. The subscripts u and d are corresponding to the forces and moments during uphill and downhill motions, respectively.

