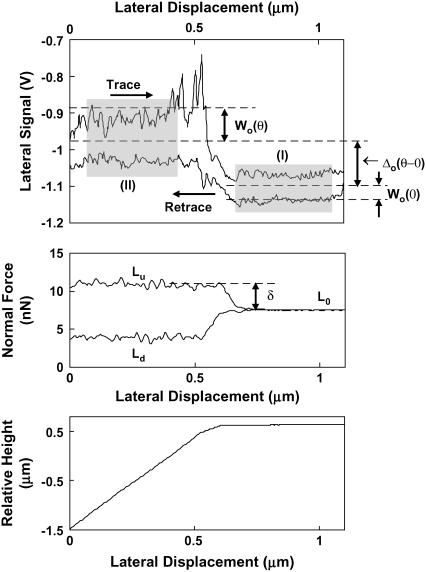
FIGURE A2.
Lateral signal loop on silicon calibration sample in deionized water with corresponding normal force and height profile using an OH-SAM functionalized nanosized probe tip, R ∼50 nm, nominal cantilever spring constant, k ∼0.06 N/m, at a normal force, L0 ∼7 nN; (I) is the tilted area of the sample (corresponding to an angle θ = 54°44′), (II) is the horizontal area of the sample (corresponding to an angle θ = 0°), Wo is the magnitude of the average lateral signal within each shaded region (taken at 10% from the edge of the tilted-horizontal border), and Δo is the baseline offset of the tilted region, Lu is the applied normal force profile during uphill motion (trace), and Ld during down hill motion (retrace).

