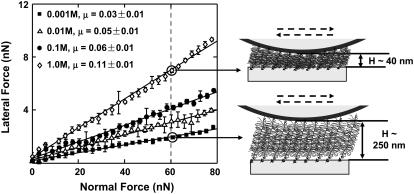
FIGURE 8.
Lateral force versus normal force for aggrecan brush using an OH-functionalized microsized probe tip (R ∼2.5 μm) in NaCl solutions, pH ∼5.6. Each data point represents the mean (±SD) of lateral signal loops at eight different locations across one hexagon pattern. Higher lateral force was measured at higher IS for the same normal force, as aggrecan layer height became smaller.

