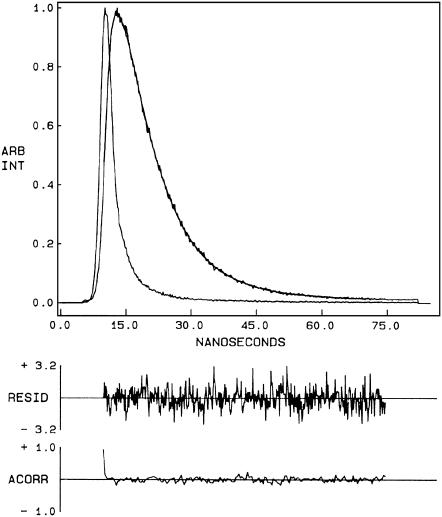
FIGURE 5.
Time-resolved fluorescence intensity decay of N-ter NBD melittin analog bound to DOPC vesicles. Excitation wavelength was at 465 nm, and emission was monitored at 530 nm. The sharp peak on the left is the lamp profile. The relatively broad peak on the right is the decay profile, fitted to a biexponential function. The two lower plots show the weighted residuals and the autocorrelation function of the weighted residuals. All other conditions are as in Fig. 4. See Materials and Methods for other details.

