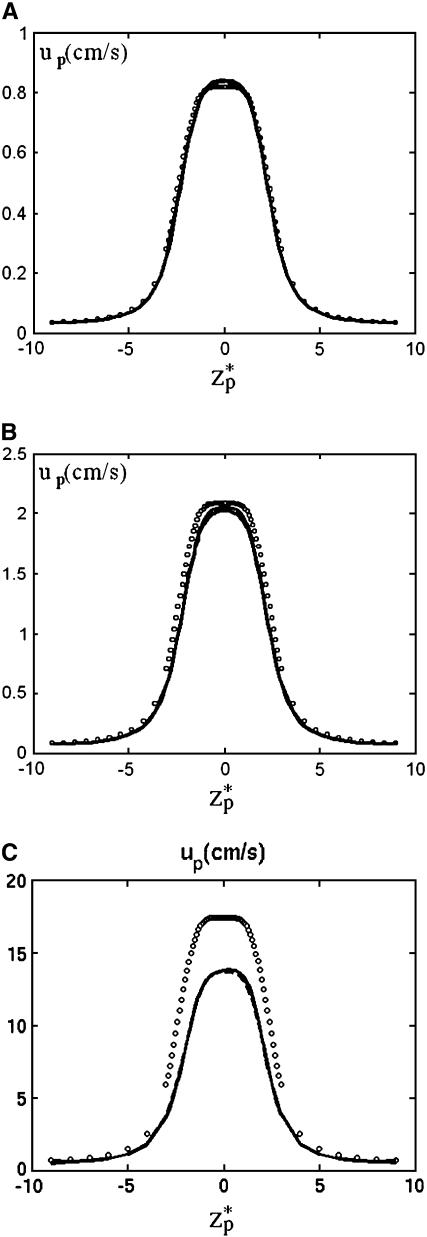
FIGURE 4.
The translocation speed of the particle as a function of the particle's location  when (A) c0 = 1 M, (B) c0 = 0.1 M, and (C) c0 = 0.01 M. The simulation parameters are the same as in Fig. 3. The solid line, dashed line, and circles represent, respectively, the results of MIM, PBM, and SVM.

