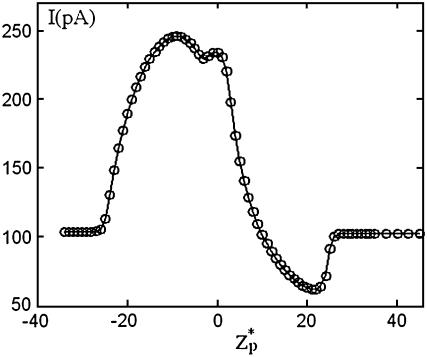
FIGURE 8.
The ionic current through the pore as a function of the particle's location  . Note a = 1 nm, b = 2.2 nm, h = 50 nm, Lp = 60 nm, H = 150 nm, B = 40 nm, φ0 = 200 mV, c0 = 0.1 M, σp = −0.15 C/m2, and σm = −0.0095 C/m2. The simulation parameters are consistent with the experimental conditions of Chang et al. (15).

