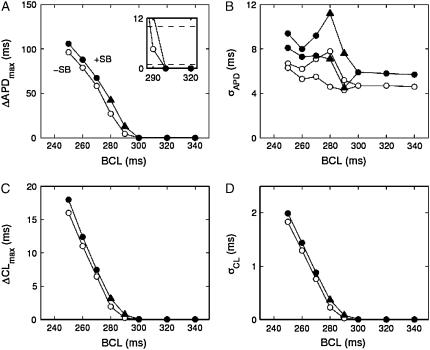
FIGURE 4.
Alternans magnitude and dispersion in homogeneous sheets. (A) Maximum difference in APD between two successive action potentials. Inset shows magnification of onset of alternans. (B) Dispersion of APD. Two values of σAPD are shown at each BCL because the dispersion of the even beats differs from that of the odd ones during alternans (the short APs are in general more uniform). (C) Maximum difference in CL between two successive action potentials. (D) Dispersion of CL. The alternation in σCL is tiny and not visible on the scale of the figure. Solid symbols indicate the presence of a structural barrier, and open symbols indicate its absence. Triangles indicate discordant alternans. “+SB” indicates presence of structural barrier, “−SB” indicates its absence.

