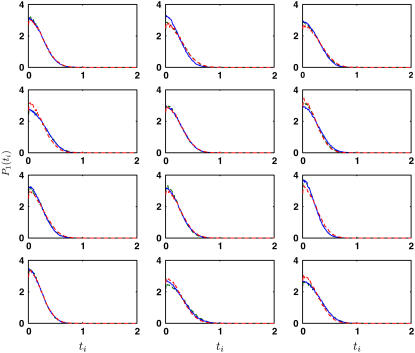
FIGURE 3.
The equilibrium singlet distributions, P1(ti), from the middle of the β-sheet (solid line) is compared with the distributions from the model of Eq. 3. Here, the triangulation scheme is Tri I. The bending constants, κi, are fitted to obtain the best agreement. When κi is uniform for all edges (red dashed line), κ = 5 kBT (the error is ε = 0.094 per bin (pb)). If three different bending constants are used (green dashed line), κ1 = 8 kBT, κ2 = 8 kBT, and κ3 = 2 kBT (ε = 0.055 pb).

