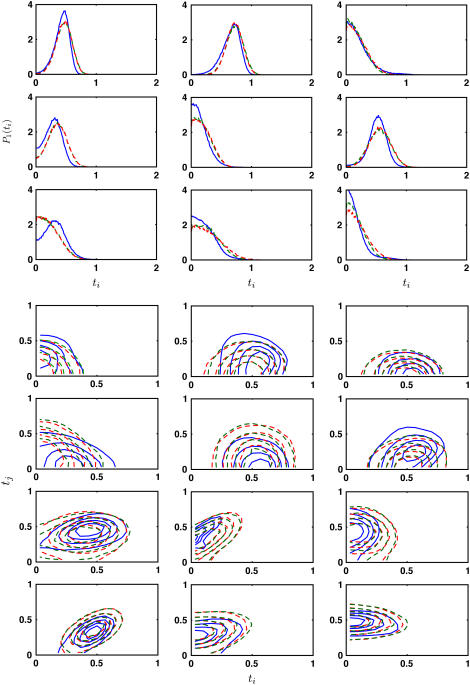
FIGURE 5.
Representative equilibrium singlet and doublet distributions, P1(ti) and P2(ti, tj), for the alanine β-sheet. The MD results (solid line) are compared with model predictions. The distributions from the uniform bending model (red dashed line, ε = 0.282 and 0.104 pb for singlet and doublet distributions, respectively) and the anisotropic model (green dashed line, ε = 0.305 and 0.096 pb) are compared with the equivalent MD distributions. The optimal uniform bending constant is 7 kBT.

