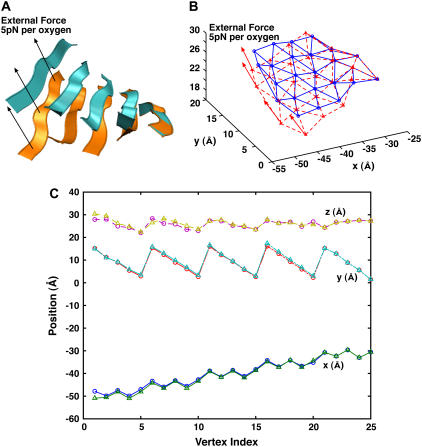
FIGURE 6.
The comparison between MD and the elastic models under an external force. (A) The MD results when 5 pN per oxygen is applied to one edge of the β-sheet. The average before and after structures are shown. (B) The coarse-grained model with the same force. The results are obtained from Monte Carlo. (C) The quantitative comparison between the results. The (x,y,z) positions of all vertices are compared. The x axis of the plot is the index of the vertices. The circles are the MD results, and the triangles are the model results.

