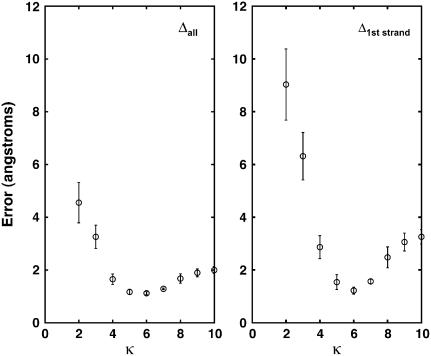
FIGURE 7.
The error between the coarse-grained model and MD results is shown. The force is applied to the first strand of the alanine β-sheet; 5 pN is applied to each oxygen atom (vertex) in the strand. The triangulation scheme is Tri I. The left graph shows the error per vertex for all the oxygen atoms in the sheet. The right graph shows the error per atom for the first strand of the sheet where the force is applied. The optimal agreement is reached when κ = 6.0 kBT for the model, consistent with the value obtained from fitting probability distributions.

