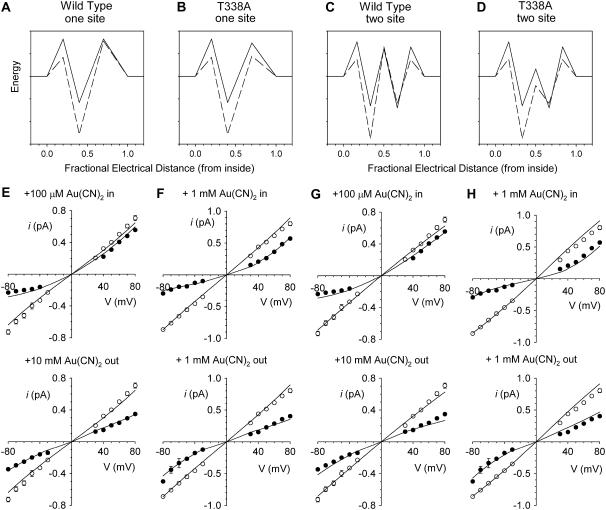
FIGURE 10.
Rate theory modeling of Cl− permeation and  block. (A–D) Best fit energy profiles for Cl− (solid lines) and
  (dashed lines) movement in the CFTR pore. (A) One-site model for wild-type. (B) One-site model for T-338A. (C) Two-site model for wild-type. (D) Two-site model for T-338A. To avoid wrongly implying physical meaning to the parameters described by the model, energy is plotted in relative units only. (E–H) Predictions of the models shown in A–D. Data points for wild-type are taken from Fig. 1, D and E, and for T-338A from Fig. 4 A. In each panel, lines represent the predictions of the model shown above that panel.

