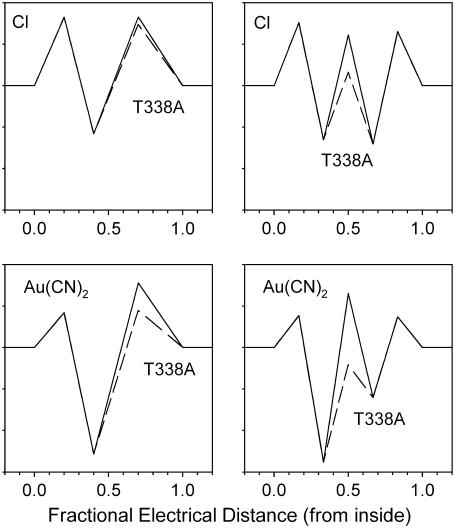
FIGURE 11.
Modeling of the effects of the T-338A mutation. Energy profiles shown in Fig. 10 are redrawn to show the effect of the T-338A mutation on Cl− and  movement in the pore, both for the one-site model (top) and the two-site model (bottom). In each case, solid lines represent the energy profile for wild-type, and dashed lines the changes made to model T-338A. The effects of the mutation are modeled as (top) lowering the energy barrier that exists between the single anion binding site and the extracellular solution, or (bottom) lowering the energy barrier that exists between the two anion binding sites. As illustrated in Fig. 10, these localized changes in energy profile were sufficient to model the salient differences in
  interactions between wild-type and T-338A.

