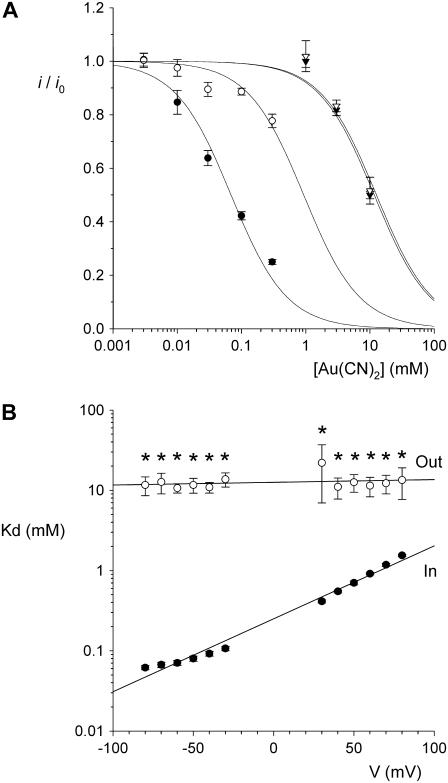
FIGURE 2.
Concentration and voltage dependence of block by  ions. (A) Fractional unitary current remaining (i/i0) after addition of different concentrations of
  to the intracellular or extracellular solution: (•) internal
  , −50 mV; (○) internal
  , +50 mV; (▾) external
  , −50 mV; (∇) external
  , +50 mV. Each of these four sets of data has been fitted by Eq. 1. (B) Mean Kd calculated from curves such as those shown in (A) for both internal (•) and external (○)
  . Mean of data from 3–5 patches. Asterisks indicate a statistically significant difference from the Kd for internal
  .
.

