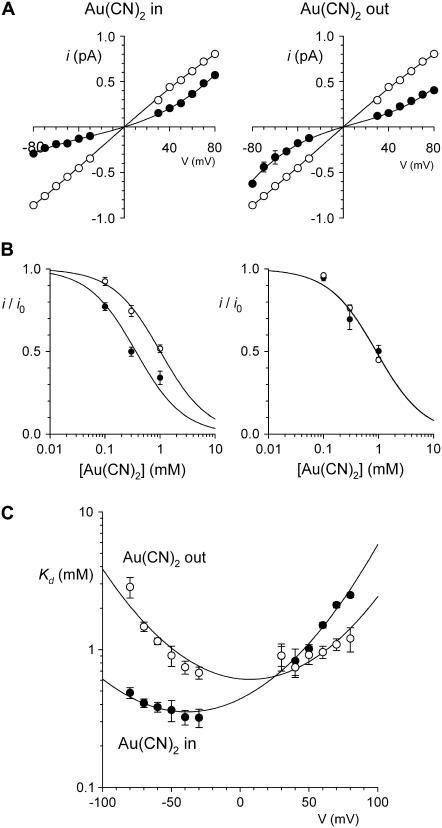
FIGURE 4.
Concentration- and voltage dependence of block of T-338A-CFTR by  ions. (A) Mean unitary current-voltage relationships for T-338A-CFTR, under control conditions (○) and in the presence of 1 mM
  (•) in the intracellular (left) or extracellular (right) solution. (B) Fractional unitary current remaining (i/i0) after addition of different concentrations of
  to the intracellular (left) or extracellular (right) solution, at membrane potentials of −50 mV (•) and +50 mV (○). Each of these four sets of data has been fitted by Eq. 1. (C) Mean Kd calculated from curves such as those shown in B for both internal (•) and external (○)
  . Mean of data from 3–8 patches in each panel.

