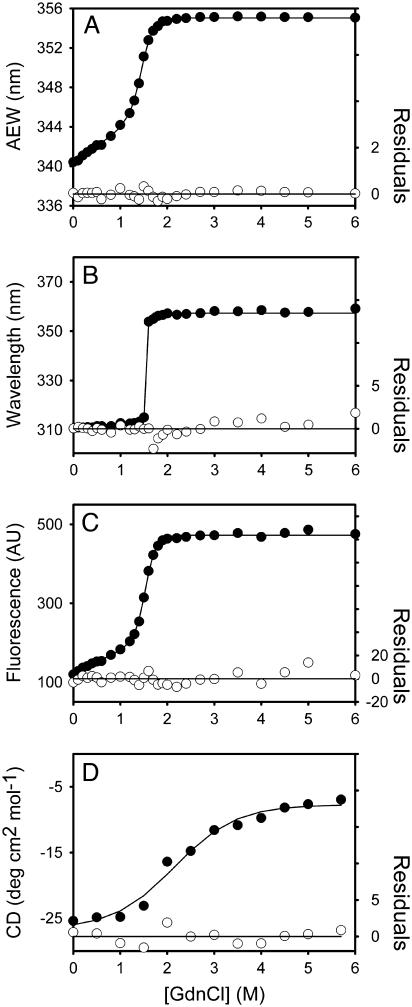
FIGURE 6.
Unfolding curves of the C-terminal domain-truncated mutant (3CLI+II) SARS-CoV main protease in different concentrations of GdnCl. The 3CLI+II enzyme (13.3 μg/ml in panels A–C, and 0.18 mg/ml in panel D) in 30 mM Tris-Cl (pH 7.7) was mixed with various concentrations of GdnCl. The fluorescence (A–C) or CD spectrum (D) was recorded after 10 min incubation at 30°C. (A) Average fluorescence emission wavelength (AEW) (Eq. 2). (B) Fluorescence emission wavelength shift. (C) Integrated fluorescence area. (D) Circular dichroism changes at 222 nm versus GdnCl concentration. Solid symbols are experimental data and the smooth curves are computer-generated best-fitted lines according to a two-state unfolding model (Eq. 7). The fitting residuals are shown under each panel (open circles).

