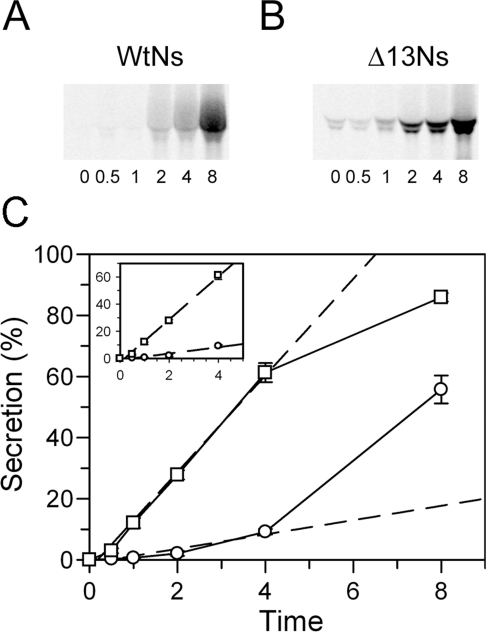
Figure 7. Secretion rate is lower for wtNs than the variant.
Pulse–chase metabolic labelling was performed in Att-20 cell lines. Proteins were metabolically pulse-labelled with [35S]methionine for 1 h followed by a chase of non-radioactive methionine for the times indicated. (A, B) Ns immunoprecipitated from conditioned media were subjected to SDS/PAGE and visualized by STORM imager. The number located at the bottom of each lane indicates the chase time in hours. Representative gels are shown. (C) Quantification of Ns secretion (circle, wtNs; square, Δ13Ns). The broken line is a linear fit of the basal level of secretion calculated from the first 4 h of data. The molecular band quantification was performed with the ImageQuant computer software. The percentage of total secretion is calculated by the amount of Ns in the media divided by the total amount of Ns in both media and cell lysates. The data show the results of two independent experiments performed in duplicate. P<0.05 using Student's t test was obtained for all time points of wtNs compared with the Δ13Ns.

