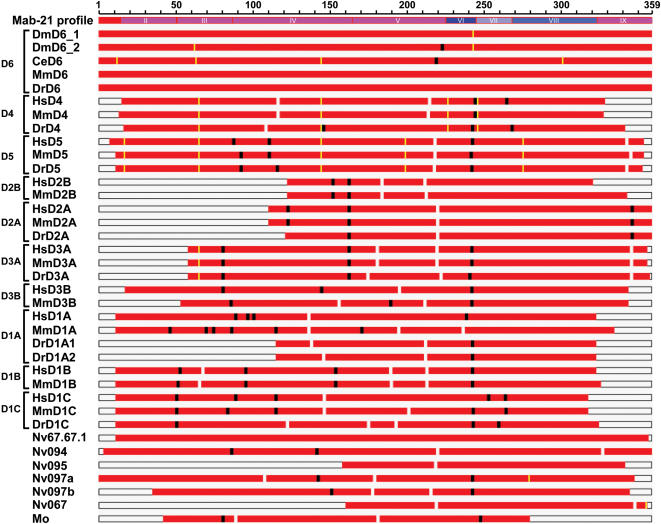
Figure 3. Evolutionary patterns of the Mab-21 domain sequence.
Rps-BLAST pairwise alignments between the psi-BLAST generated Mab-21 profile and DANGER sequences. Comparison of insertions (in profile sequence; black boxes) and deletions (in profile sequence; white boxes), and correspondence of indels (>3 amino acids) with intron positions (yellow boxes). For comparison, all DANGER sequences are mapped onto the Mab-21 profile sequence according to pairwise alignment coordinates. The microdomains II–VIII are also shown. Species abbreviations are as in Figure 1A.

