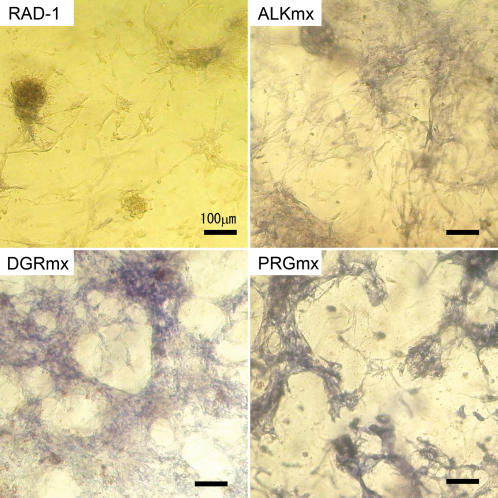
Figure 5.
ALP Staining images after culturing on the different hydrogels for two weeks. The bar represents 100 µm. RAD-I∶RADA16 1% (w/v), ALKmx∶ALK 1% (w/v)+RADA16, DGRmx∶DGR 1% (w/v)+RAD, PRGmx∶PRG 1% (w/v)+RADA16 (all mixture ratio is 1∶1). The bluish color intensity correlates with the high ALP activity. RADA16 shows low cell adhesion to the hydrogel and the cells are aggregated. The cell attachment increases in DGR and PRG scaffolds were considered as a result of RGD cell attachment sequence. ALP, DGR and PRG showed higher ALP activities compared to RADA16-I, especially staining intensity of PRG.

