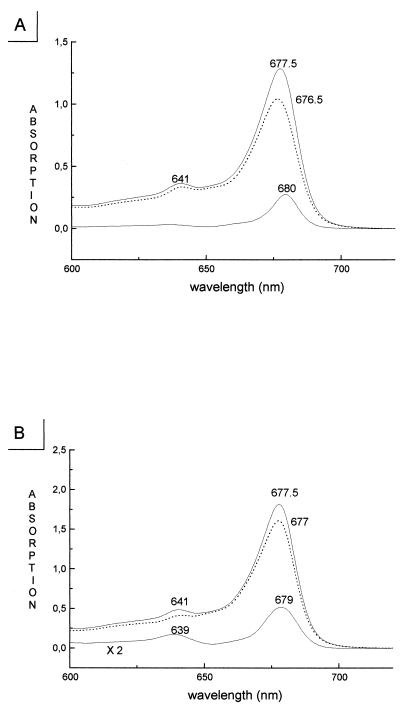
Figure 3.
Determination of the spectral characteristics of individual chromophores within CP29 by difference spectroscopy. (A) Absorption spectra of wild-type CP29 (Top) and of the H216F mutant (broken curve, Middle) lacking a single Chl-a molecule. The Bottom curve represents the wild-type minus mutant difference spectrum that is thought to represent the absorption spectrum of the individual Chl molecule bound to the A2 site. A single peak in the difference spectra was also obtained for mutations affecting sites A1, A2, and A5. (B) Absorption spectra of wild-type CP29 (Top) and of the H245L mutant (Middle) lacking the Chl-binding site B3 having mixed Chl-a/Chl-b occupancy. Difference spectra (Bottom curve) with peaks in both the Chl-b (630–660 nm) and the Chl-a (660–684 nm) spectral ranges were obtained with mutations affecting sites A3, B3, B5, and B6.

