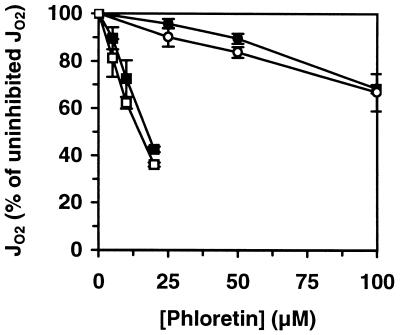
Figure 3.
The steady-state oxygen consumption flux as a function of the phloretin concentration at 0.36 (■, □) and at 5 mM glucose (●, ○). The open and closed symbols represent independent experiments that were carried out with two batches of trypanosomes, isolated from different rats. Each datapoint represents average ± standard deviation of at least three replicates.

