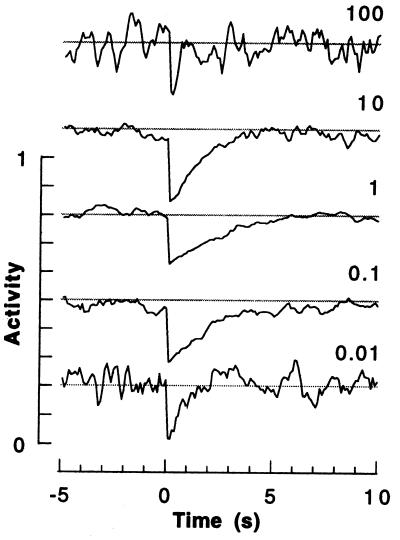
Figure 3.
Changes in array activity produced by a stepwise change in ligand concentration. Each individual trace shows how the activity of the lattice (measured by the average fraction of active receptors during a period of 10,000 time steps or 0.1 s) changes with time. The lattice was equilibrated with ligand at one concentration, and then its activity followed as this concentration was doubled (at time zero). The traces are labeled by the initial value of c/c0.5 and have been displaced vertically (the gray lines indicate the average activity of an adapted array, A0 = 0.5).

