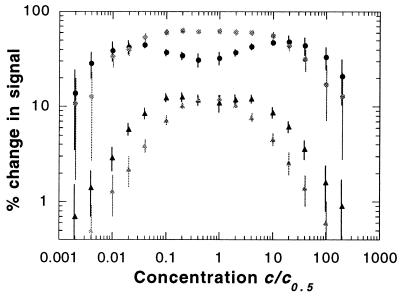
Figure 4.
Response of a receptor array to a step change in concentration. The change in the signal, immediately after the concentration was doubled, is plotted as a function of the initial concentration c. The two pairs of data sets are for a coupled array of receptors with EJ/kT = 0.4 (circles) and the same number of independent receptors (triangles). Two values of ligand-binding energy are represented: EL/kT = 2 (gray) and EL/kT = 4 (black). The vertical bars indicate the typical noise in the signal when it is averaged over the response time (0.1 s).

