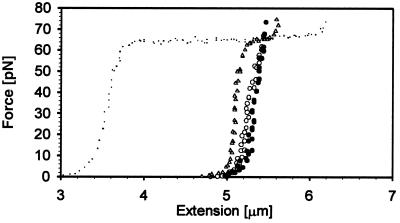
Figure 4.
F vs. extension plot for dsDNA–RecA ATP filaments. Fully coated dsDNA–RecA ATP form (empty circles correspond to the extension cycle and filled circles indicate the relaxation cycle). After RecA was depleted from the surrounding buffer an intermediate dsDNA–RecA ATP filament (triangles) that did not show any hysteresis as in the fully coated version showed up. The small dots correspond to dsDNA, shown here for reference.

