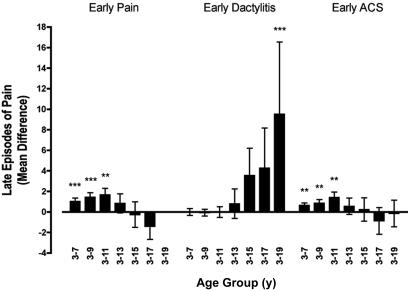
Figure 1.
Associations between early predictors and late episodes of pain. Depicted here are the mean differences in the number of late painful episodes for groups defined by the occurrence or not of each of the 3 early predictors (whiskers are SEs). Mean difference = (mean number of painful episodes in predictor-positive group) − (mean number of painful episodes in predictor-negative group). The mean differences are shown for cumulative, overlapping intervals of follow-up beginning with the third birthday. **P < .01; ***P < .001.

