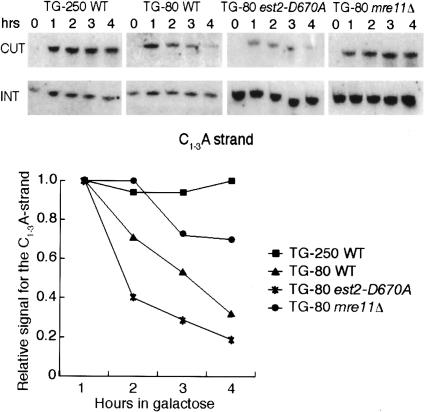
Figure 3.
5′ end resection is inhibited at long TG arrays. (Top panel) Southern blots monitoring resection of the C1–3A strand at TG-250 in a wild-type strain and TG-80 repeats in wild-type, est2-D670A, and mre11-Δ strains. (INT) The internal loading control (band of 165 bp specific for a region on Chr. XV); (CUT) a band of 418 bp or 239 bp, corresponding to the C1–3A strand of the long or short telomeric tracts, respectively. (Bottom panel) Quantification of the relative signal for the C1–3A strand obtained by measuring the amount of the “CUT” band relative to the internal control “INT,” normalized to the efficiency of cleavage.

