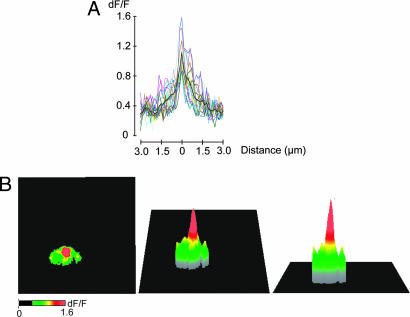
Fig. 2.
Spatial profile of CCMs from squid optic lobe synaptosomes. (A) Profiles of 19 microdomains from 12 synaptosomes. (Black line shows the average of all traces.) The center of the Ca2+ influx was determined by averaging 20 frames from different time points during a single trial and then locating the pixel in which the signal was the brightest. The spatial profile of a domain was obtained by averaging the horizontal and vertical lines located through the center. (B) Three-dimensional projection of a CCM.

