Fig. 5.
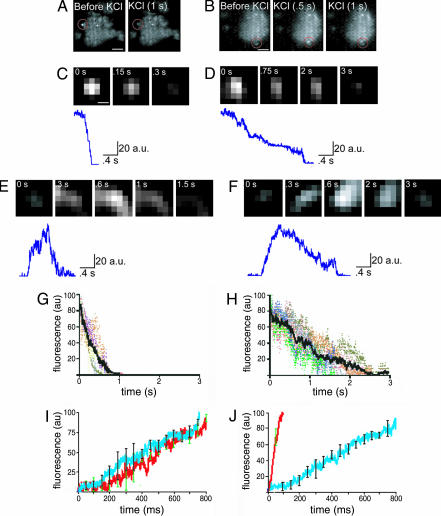
Different mechanisms of vesicle fusion. (A) Single video frames showing a cerebellar synaptosome loaded with FM1-43 dye and imaged by TIRFM. Circled in red is a fluorescent spot that was present initially and which disappeared after depolarization by KCl. (Scale bar: 1.5 μm.) (B) Single video frames showing a synaptosome loaded with FM1-43 dye as shown in A. Circled in red is an area where, after depolarization with KCl, a fluorescent spot appeared (i.e., a newly docked vesicle) and later disappeared. (Scale bar: 1.5 μm.) (C) To analyze the kinetics of single fluorescent spots, a square around the fluorescent spot was excised and the fluorescence was fit to a 2D Gaussian function. Background then was subtracted. The fluorescent spot shown in C is the same as in the one inside the circle in A, after Gaussian fitting and background subtraction. The times shown at the top refer to the times after depolarization. (Scale bar: 0.30 μm.) Same scale was used for D–F. At the bottom of C–F, the trace show the kinetics of the optical signal measured at the center of the fluorescent spot. (D) A fluorescent spot similar to the one in C, but with different kinetics. Note the slower rate of fluorescence decay. (E) A fluorescent spot analyzed as in C and D, similar to the one seen in B. The times refer to the time after depolarization. Note that at 0.8 s after depolarization, the spot achieves peak fluorescence and then starts to decay. (F) A spot similar to the one in E but with different kinetics. Note the similar kinetics of the rising phase and the distinct kinetics of the decay. (G) Average time of decay of the “full fusion” events. In color are traces of six different experiments, and in black is an average of the six experiments. (H) Average time of decay of the kiss-and-run events. In color are traces of experiments from six different preparations, and in black is an average of these six experiments. (I) Comparison of the rise time of the full fusion events with the kiss-and-run events. Shown is the average of each group with error bars. Error bars are standard deviation of the mean. Blue with black error bars, kiss-and-run events; red with green error bars, full fusion events. No significant difference was seen in their time of rise (n = 6 different synaptosomes for each experimental group). (J) Comparison of the time of rise when extracellular calcium concentration was changed from 2 mM to 10 mM. Blue with black error bars, 2 mM Ca2+; red with green error bars, 10 mM Ca2+. Note the faster rise of the fluorescence with higher calcium concentration (n = 4 synaptosomes with 2 mM Ca2+ and 10 synaptosomes with 10 mM Ca2+).

