Fig. 4.
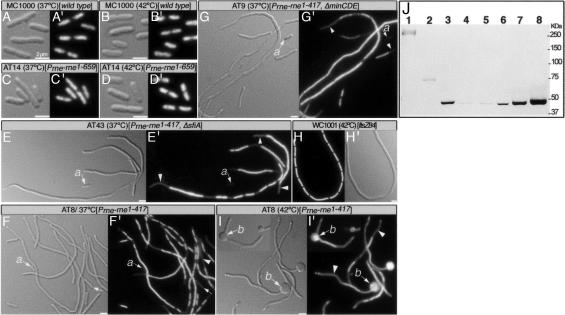
Phenotypic abnormalities associated with the loss of RNaseE helical organization. Cell morphology is shown by differential interference contrast, and DNA distribution is shown by DAPI fluorescence. (A, A′, B, and B′) MC1000 grown at 37°C (A and A′) or at 42°C (B and B′). (C, C′, D, and D′) AT14 [Prne-rne1–659] grown at 37°C (C and C′) or at 42°C (D and D′). (E and E′) AT43 [ΔsfiA, Prne-rne1–417] grown at 37°C. (F, F′, I, and I′) AT8 [Prne-rne1–417] grown at 37°C (F and F′) or at 42°C (I and I′). (G and G′) AT9 [ΔminB, Prne-rne1–417] grown at 37°C. (H and H′) WC1001 [ftsZ84ts] grown for 3 h at 42°C. The arrows show positions of anucleate cells; the arrowheads mark the nucleoid-free regions; a shows anucleate cell; b shows the bulges in AT8 [Prne-rne1–417] cells grown at 42°C. (Scale bar: 2 μm.) (J) Immunoblot of total protein (54) of AT25 [Prne-rne::HA] (lane 1), AT27 [Prne-rne1–659::HA] (lane 2), AT28 [Prne-rne1–417::HA] (lane 3), and AT1/pRNE31 [Δrne/Plac-rne1–417::HA] grown in the presence of 0 μM IPTG (lane 4), 1 μM IPTG (lane 5), 10 μM IPTG (lane 6), 100 μM IPTG (lane 7), or 1 mM IPTG (lane 8). Molecular masses are indicated in kDa. Thirty micrograms (lanes 1 and 2) or 5 μg (lanes 3–8) of protein was loaded.

