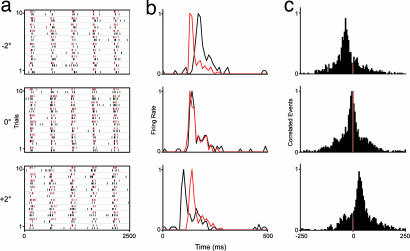
Fig. 4.
Responses of a pair of control LGN cells to three grating orientations (−2°, 0°, +2°). Shown are raster plots (a), normalized PSTHs (b), and normalized cross-correlograms (500-ms window; y axis, normalized correlated events) (c). In a and b, red and black differentiate responses of the two cells. Grating contrast 0.36, spatial frequency 0.66 cycles/°, temporal frequency 2 Hz, 10 trials, five stimulus modulations.

