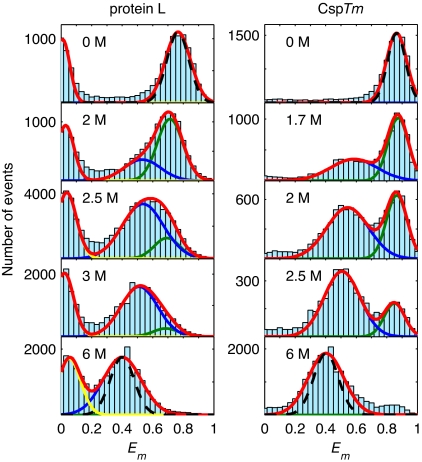
Fig. 2.
FRET efficiency histograms for protein L (Left) and CspTm (Right) for several denaturant concentrations. The peaks at high and intermediate Em correspond to the folded and unfolded state populations, respectively. The green and blue lines are Gaussian fits to the folded and unfolded subpopulations. Molecules lacking an active acceptor (yellow) appear at Em ≈ 0. The Poissonian shot-noise contribution (29) to the folded and unfolded peak widths (black dashed lines) is shown at 0 M and 6 M GdmCl.

