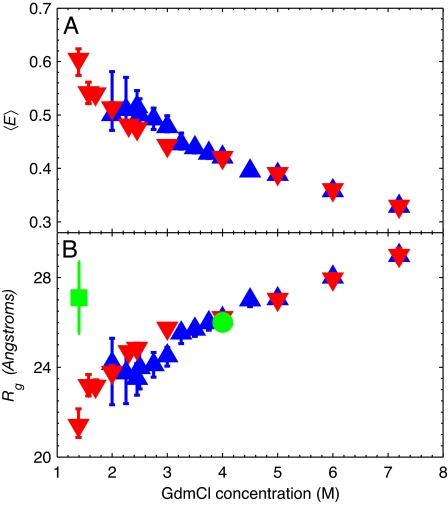
Fig. 3.
Dependence of FRET efficiency and Rg on denaturant concentration. (A) Mean FRET efficiencies 〈E〉 for the unfolded states of protein L (blue triangles) and CspTm (red inverted triangles) after γ correction. (B) Rg for protein L and CspTm in the unfolded state determined from 〈E〉 assuming slow chain dynamics and a Gaussian chain model for the end-to-end distribution. The Rg values previously determined by equilibrium SAXS at 4 M GdmCl (green circle) and by time-resolved SAXS at 1.4 M GdmCl (green square) are also shown (20).

