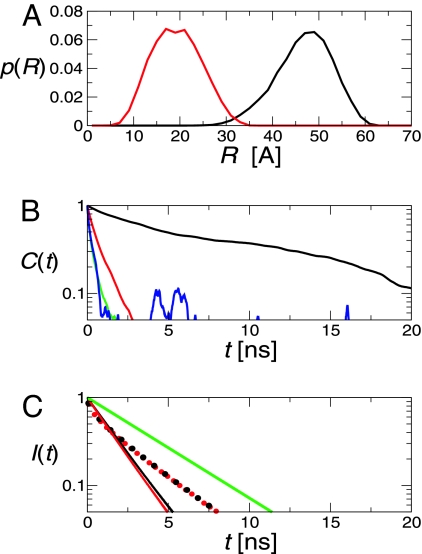
Fig. 4.
Langevin simulation results for protein L and CspTm. (A) Donor–acceptor distance distributions for folded protein L (black line) and CspTm (red line). The N- and C-terminal α carbons are separated by 38 Å and 13 Å in the structures of protein L and CspTm, respectively. (B) Decay of correlation functions for donor–acceptor distance (black line), reorientation of the donor (green line) and acceptor (red line), and κ2 (blue line). (C) Decay of donor fluorescence in protein L calculated with (red lines) and without (black lines) the assumption of complete orientational averaging; curves for the folded and unfolded states are solid and broken, respectively, and the isolated donor decay is shown for reference in green.

