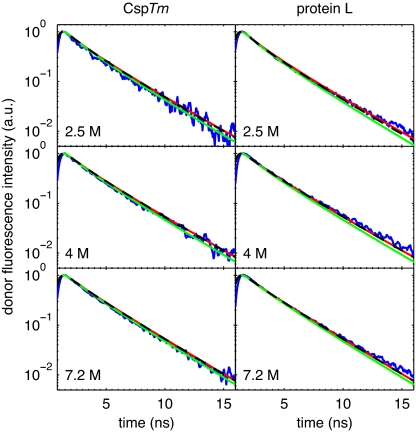
Fig. 5.
Comparison of measured (blue lines) lifetimes for CspTm (Left) and protein L (Right) at 2.5 M (Top), 4 M (Middle), and 7.2 M (Bottom) GdmCl with those calculated assuming no chain dynamics during the donor lifetime for several Peq(R): Gaussian chain (red lines) and bead models with only excluded volume (green lines) and both excluded volume and attractive interactions (black dashed lines).

